Using ATAM to Analyze and Evaluate Architecture
Software-Architecture ·Software development is becoming more complex over the years. Let’s talk about how the Architecture Trade-offs Analysis Method can help to validate the architecture and and expose hidden risks to the Stakeholders.
When validating an Architecture Design we want to fulfill the interests and concerns of all the Stakeholders. On way to do this is using Quality Attributes Scenarios for every Quality Attribute. There are 2 types of scenarios:
General Attribute Scenario
Are generic scenarios used to characterize any kind of system.
Example:
In this example we want to check the server availability quality attribute:
| Component | Component Value |
|---|---|
| Stimulus Source | End-user input, CRON tab, etc |
| Stimulus | Invalid input, High request volume, etc |
| Environment | Stating up, Shutting down, Recovering from failure, Operating normally |
Concrete Attribute Scenario
Are dedicated scenarios used to characterize an specific kind of system.
Example:
Here we can test an specific attribute value regarding consistency of the stock while purchasing a product.
| Component | Component Value |
|---|---|
| Stimulus Source | Customer (end-user) |
| Stimulus | Request to ad item to shopping cart |
| Environment | Not enough stock |
With both types of scenarios we can now identify the possibles responses and response measurements.
Scenarios Components
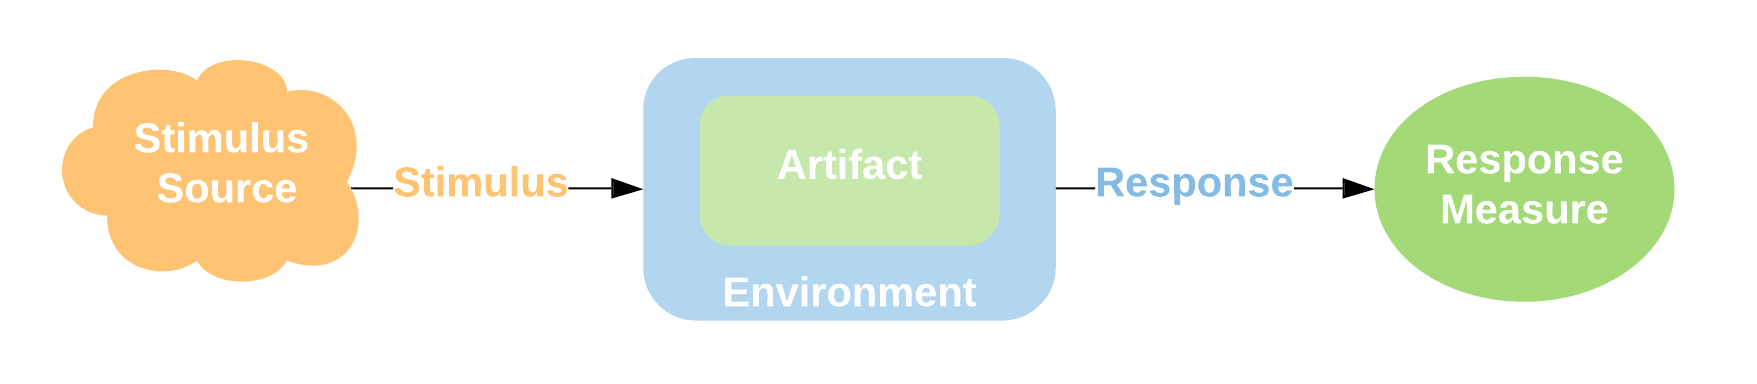
Stimulus Source
It is any action that can create a stimulus. They could be internal or external. An Internal Stimulus example is a CRON tab, that time to time triggers an action. An External Stimulus example could be an end-user button click or simply request a page load.
Stimulus
The Stimulus source sends a Stimulus which is any kind of condition that makes the system to respond. They can also be internal or external, so an invalid input provided by the end-user is a external stimulus whereas internal server error, like memory limit exceeds, is an internal stimulus.
Artifact
The artifact is the subsystem or component that handles the stimulus and generates the response. For instance it could be the end-user invalid input error handling or a failure recovery for an internal fault issue.
The stimulus should not communicate directly with the whole system, instead its response will become source of other stimulus and communicate with them as a chain.
Environment
The environment is the mode or state of the system when receiving an stimulus. It could be for instance the state of the user (logged in / out), the amount of free memory in the server, the environment variables set, the server configuration, network configuration and so on.
Response
How the artifact behave after it receives a stimulus in certain environment will generate an specific response. It could be for instance, logging the error, sending an alert message, etc.
Response Measure
It is a metric to quantify a quality attribute though the response. It must be quantitative and objective. Example: response time, recovery or repair time, etc.
It is a good practice to map the scenarios in tables to get a more accurate vision of the quality attributes being tested. Let’s see some general and concrete scenarios examples:
ATAM - Architecture Tradeoff Analysis Method
After understanding how to classify and measure quality attributes we can use the ATAM method created by the Software Engineering Institute to analyze and evaluate the architecture.
The ATAM method intend do be unbiased allowing outsiders that did not participate of the system conception os architecture to evaluate it. The ATAM requires three main groups for the analysis and evaluation:
Evaluation Team
-
Designers: Who did the system architectural design. I.e. Software architects and engineers.
-
Peers: They are part of the project, but did not participate of the design.
-
Outsiders: Architecture specialists outside of the group or organization. This group is important to eliminate any kind of bias within the project.
Project Decision Makers.
According to the evaluation output, it is important to have people to make decisions and accepts the trade-offs or system changes:
- Clients.
- Product Owners.
- Project Managers.
- Lead Developers.
- Software Architects.
Architecture Stakeholders
This groups includes the ones who want the architecture meets the business needs, but are not directly or actively involved with the analysis/evaluation process.
- End-users.
- Developers.
- Support.
Let’s have a high level vision of the ATAM flow:
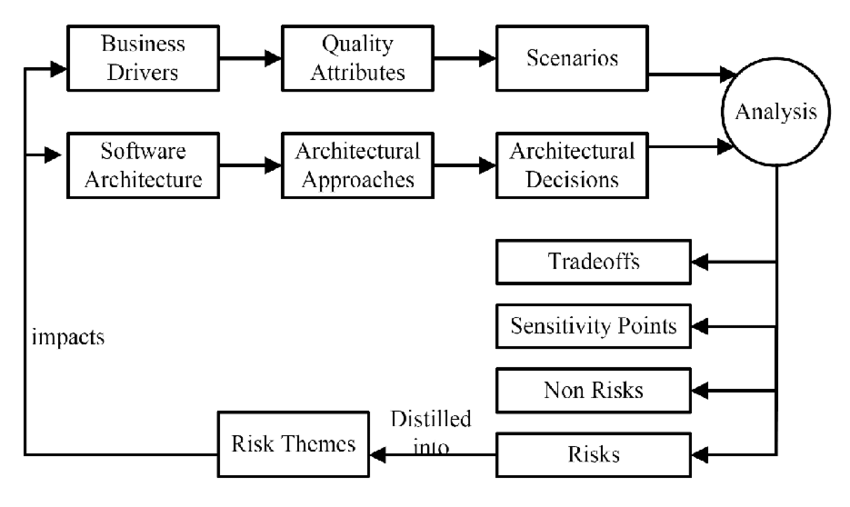
-
The Business Drivers have an issue to be solved. So a software need to be created to solve it.
-
These Business Drivers will show the Software Architecture created as a solution to their issue to every one involved.
-
The Business Drivers use the Software Architecture to identify the system Quality Attributes, chose and Architectural Approach and make the Architectural Decisions and finally create the quality attribute Scenarios.
-
These scenarios run through Analysis and are evaluated generating as output: Tradeoffs, Sensitivity points, Non-risk and Risk scenarios.
-
The Risk Scenarios are analyzed individually and classified in Risk Themes.
ATAM Steps
1. Present the ATAM
Present the context for evaluation, expectations, procedures, outputs and evaluation metrics used in the ATAM.
2. Present the business Drivers
At this phase all these must be identified:
- Who are the business drivers.
- Business problems and goals for the system are presented by the Project decision makers.
- System’s features.
- System’s requirements.
- Project constraints.
- Project scope.
3. Present the Architecture
Present:
- Current Architecture state.
- Expected Architecture state.
- Impact of following project constraints in the architecture:
- Time / Deadline.
- Cost / Available resources.
- Complexity of the problem.
- Quality expectations.
4. Identify the Architecture approaches
This is the first analysis activity.
- Examine the architectural patterns used in the system.
- Analyze documentation.
- Ask questions and clarify any doubt about the system.
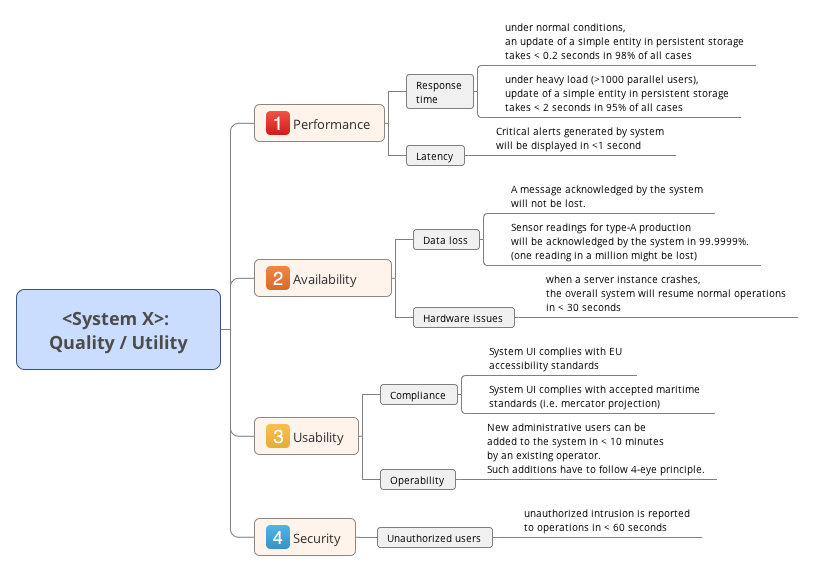
5. Create a Quality Attribute Tree
Create a quality attribute utility tree, the requirements for each quality attribute is detailed in a quality attribute utility tree.
The ASRs (Architecturally Significant Requirements) provided by the Business Drivers for all the quality attributes are mapped in the Quality Attribute Utility Tree.
As quality attributes are general, the utility tree splits them into attribute refinements, which are more specific qualities of a system.
For each ASR we can associate a priority value to identify must-haves requirements.
6. Analyze the Architectural approaches
For each ASR collected in the previous step, check how the architecture meets them or not, them document the Tradeoffs, Sensitivity points and Risk and non-risk scenarios.
7. Brainstorm and prioritize scenarios
To have an idea about how would the day-to-day system usage be, gather scenarios from all the ATM group of participants. The scenarios will be prioritized by the Stake holders and using the ASRs collected previously.
8. Re-analyze the architectural approaches
Based on the top 5 to 10 scenarios collected in the previous step, create a utility tree and validate with the system architect to discover which and how the scenarios can be achieved with the system design.
9. Present the results
At this step you must have:
- Evaluation results.
- Risk scenarios grouped and categorized into risk themes.
- Architecture documents produced.
- Utility tress produced.
- Risk and non-risk scenarios
- Sensitivity points.
- Tradeoffs.